What We Can Learn From an 18 Country Study on Dietary Fat
Article at a Glance
- A large 2017 study, which analyzed data from over 135,000 individuals from 18 countries seems to contradict the “fat is bad” messaging that still permeates many nutrition circles, but careful drawing too many conclusions.
- The authors showed that a higher carbohydrate intake (approximately 60% of dietary intake) was associated with an increased risk of overall mortality, but not an increased risk of cardiovascular disease.
- The opposite effect was seen with fat. When certain fats replaced carbohydrate, mortality rates went down, but risk of cardiovascular disease did not go down significantly with increased fat intake.
- Higher saturated fat intake was associated with a lower stroke risk.
- The headline story is that replacing carbohydrates with PUFAs was associated with an 11% lower risk of mortality, whereas replacement of carbohydrate with saturated fat, MUFAs, or protein was not significantly associated with risk of total mortality.
- Failing to report on total calories consumed likely placed some people who were not getting adequate nutrition in a “high carb” group. Failing to account for the potential of poverty conditions in these groups by showing total calories consumed when on a high carb diet compromises the findings because malnutrition, and not carbohydrate consumption, may have led to some of these poorer outcomes in overall mortality.

Contents
The 2017 Lancet PURE “pro fat” study
Study name: Associations of fats and carbohydrate intake with cardiovascular disease and mortality in 18 countries from five continents (PURE): a prospective cohort study. Published in the Lancet Journal in 2017 this huge epidemiological study (135,335 individuals) is one of the latest attempts to address the relationship between macronutrients and cardiovascular disease.Study details
- Men and women aged between 35-70 years from 18 countries (including the U.S.A.).
- Followed for approximately 7.5 years
- Dietary intake was recorded using questionnaires
- Subjects were then separated into quintiles based on nutrient intake for carbohydrate, fat (saturated, monounsaturated and polyunsaturated) and protein
- Relationship between these nutritional indicators and overall mortality along with a variety of cardiovascular events were recorded.
The results – is a high carb diet dangerous?
The authors showed that a higher carbohydrate intake (approximately 60% of dietary intake) was associated with an increased risk of overall mortality, but not an increased risk of cardiovascular disease. When looking at total fat intake, and the various fat subtypes, they saw the opposite effect with higher fat intakes correlating with reduced overall mortality risk (see criticisms relating to “poverty diets” below). The study authors provided some nice visuals which I’ve included below. The top row of the graphs is looking at overall mortality, whereas the bottom row is looking at major cardiovascular disease. Then from left to right we have the dietary contribution of total, saturated, monounsaturated and polyunsaturated fat followed by carbohydrate. On each graph the horizontal axis shows increasing percentage intakes, whereas the vertical axis shows relative risk. To interpret each graph, follow the black line (the blue dots represent the variation in responses). Where it moves above the dotted black line that diet is associated with a negative effect, whereas when it moves below the line it is a positive effect, (generally speaking we would also like to see the blue dots above or below the line as well). Two important things to take note of when reading the graphs. Firstly, for carbohydrates the graphs start at 40% of intake rather than 0% as with the fat graphs, so considerably higher than many ketogenic diets out there. Secondly, the vertical axis is smaller on the cardiovascular graphs, which can make any effect look more dramatic.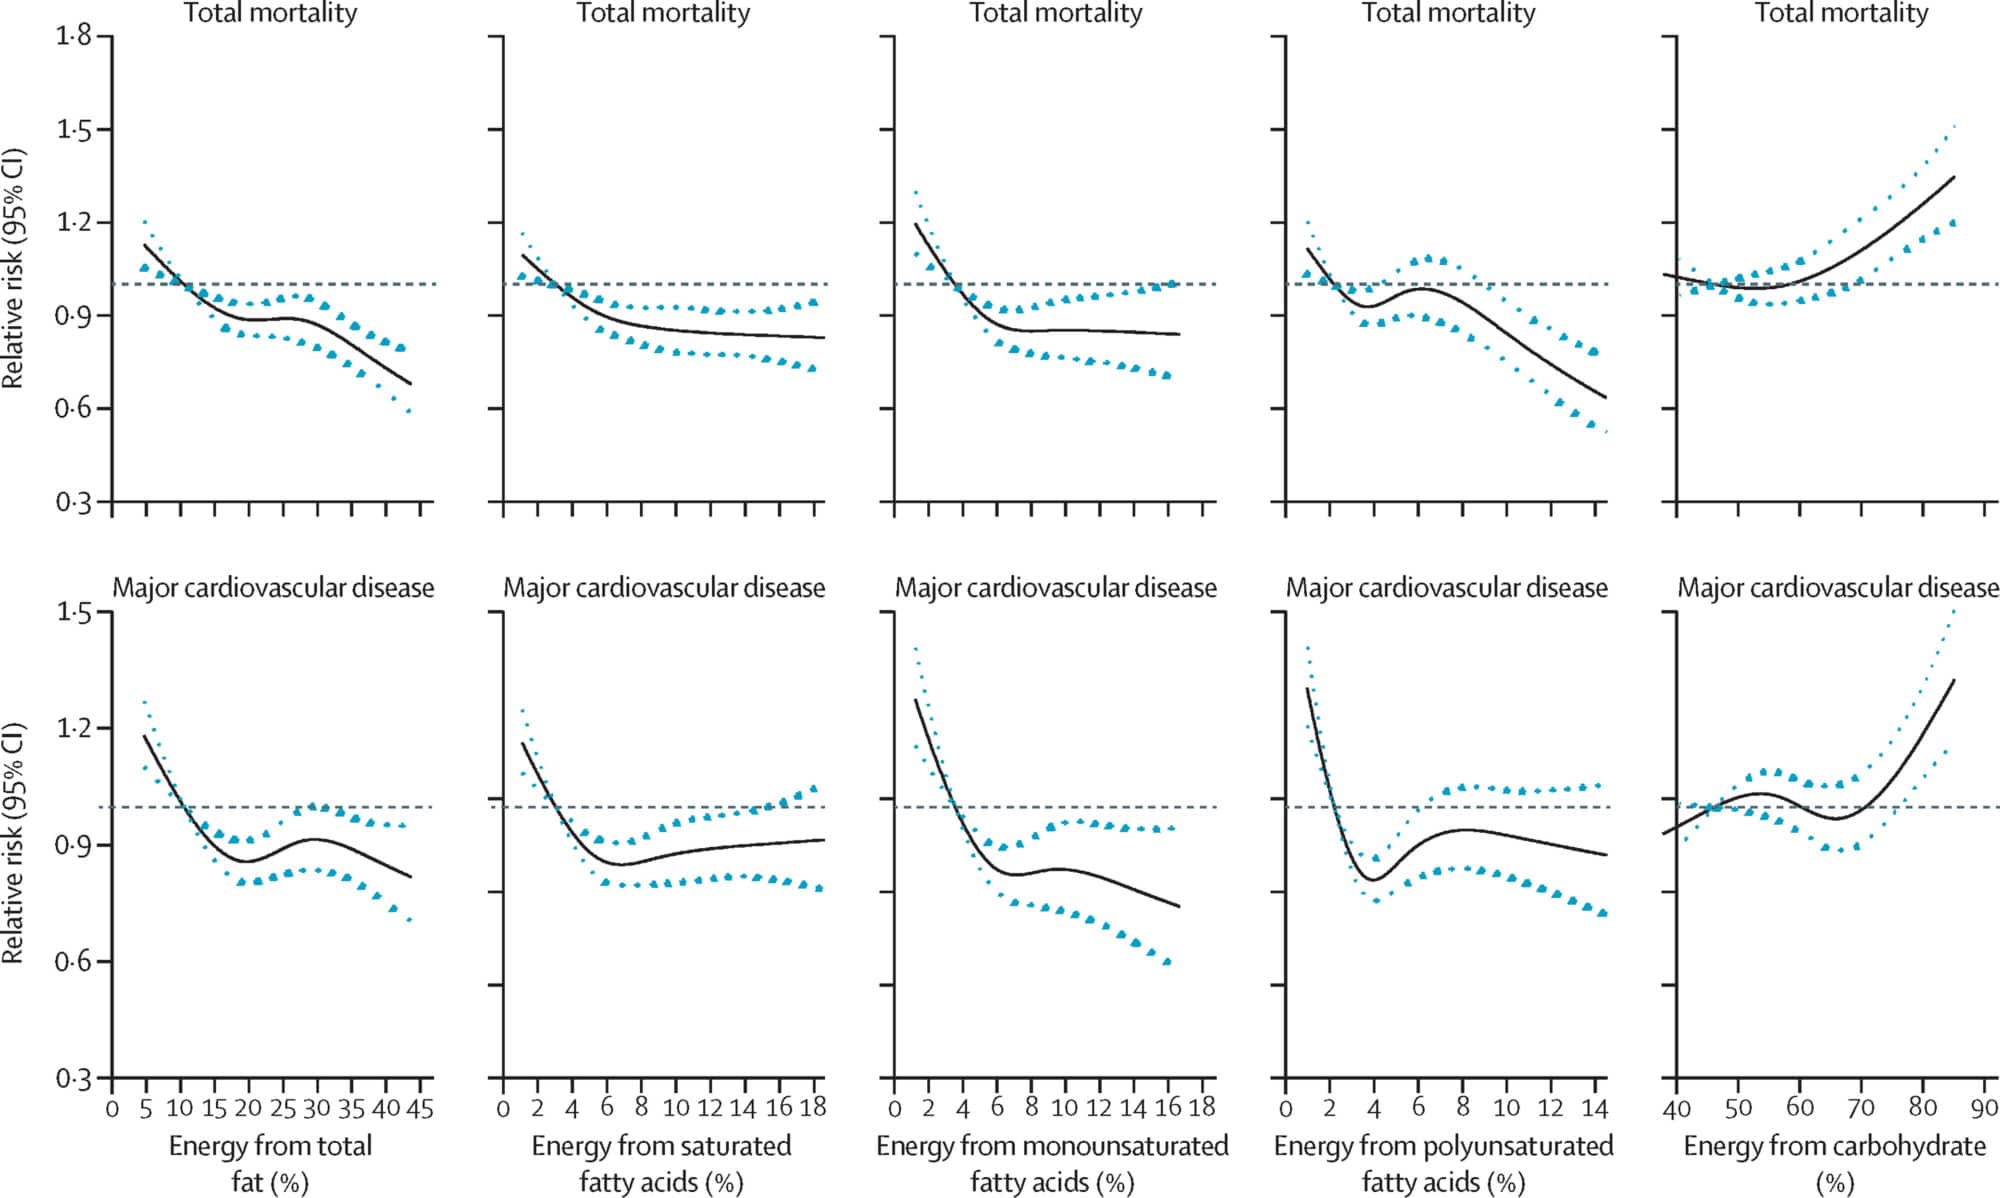
The authors came out quite strongly with their concluding statements, which I’ve included below:
“In this large prospective cohort study from 18 countries in five continents, we found that high carbohydrate intake (more than about 60% of energy) was associated with an adverse impact on total mortality and noncardiovascular disease mortality. By contrast, higher fat intake was associated with lower risk of total mortality, non-cardiovascular disease mortality, and stroke. Furthermore, higher intakes of individual types of fat were associated with lower total mortality, noncardiovascular disease mortality, and stroke risk and were not associated with risk of major cardiovascular disease events, myocardial infarction, or cardiovascular disease mortality. Our findings do not support the current recommendation to limit total fat intake to less than 30% of energy and saturated fat intake to less than 10% of energy. Individuals with high carbohydrate intake might benefit from a reduction in carbohydrate intake and increase in the consumption of fats.” “Global dietary guidelines should be reconsidered in light of the consistency of findings from the present study, with the conclusions from meta-analyses of other observational studies and the results of recent randomized controlled trials.”
Potential Criticisms
As you can expect, this study generated a lot of discussion and there are some significant criticisms of the work, and the strength of the authors interpretation. I’ll try to cover some of them here.Effect of total intake
A major issue is the lack of examination of the total dietary intake and how percentage intake related to this. For example the researchers examined the replacement of carbohydrate as percentage, with fat as a percentage. However they did not report variation in total calories, or the degree to which very high intake of carbohydrate as a percent of that total correlated with very low calorie intake overall, and malnutrition, which feeds into the second point.Poverty diets and caloric deficit
Carbohydrates as a food source can cover a huge range of food types, from fiber rich vegetables to highly refined pure sugars. By grouping everything in together it is not possible to determine if a particular carbohydrate source is driving this effect. Furthermore the very high carbohydrate diets seen are often associated with a “poverty diet” which likely impacts on health in other ways (e.g. low protein intake). For example the average carbohydrate intake in “Europe and North America was 52.4% whereas in “South Asia” it was 65.4%. These issues are quite major and the authors could have addressed them by showing a by country breakdown, rather than creating quintiles per region and then merging the data together. The formatting of the questionnaire could also have allowed for a better breakdown of carbohydrate intake, as was seen for fat intake, even a high-GI/low-GI comparison would have been useful, although as we know from the recent Lancet 2019 study GI as a metric is not the best. This has the potential to create a fat bias, where those countries with higher fat intakes, such as the US, also have access to better healthcare and so are more likely to survive. It is possible to address issues such as these by sub-analyzing the data i.e. doing a comparison within the US cohort, but this was not performed. The authors to attempt to address this by including household income, household wealth, or economic level into their analysis where they report the same effect in a supplementary figure, and by performing an analysis of Asian and non-Asian regions.Relevance to Western diets
This actually ties in with the previous point. We see that carbohydrate intake differs widely between region, and this is also true of fat. For example the highest fat intake quintile of 33-38% fat in the study actually correlates with an average western intake. As only approximately 10% of study participants are located in western countries, the relevance of the study may be more limited.Only partial fat analysis
One of the exciting findings was that replacing carbohydrates with polyunsaturated fats was beneficial, which was not seen with saturated fats. But they didn’t take that extra step and investigate what happens if saturated fats are replaced with polyunsaturated fats, this would have helped answer one of the major areas of discussion surrounding dietary fat today.Some missing metrics
Not, a true criticism as such as it would likely have made the study too large and unwieldy but it’s a shame that trans-fat intake wasn’t recorded. Similarly, some level of genetic analysis would have been really exciting, especially around SNPs with a known effect on fat metabolism. Also probably out of scope for the study, but seeing some more “extreme” intakes would perhaps have been useful, for example a “low” carbohydrate intake of 40% is significantly higher than even the most flexible ketogenic diet.Our take
A great study with loads of interesting data, however the relevance to the west is limited, especially those following diets outside of the study parameters, such as ketogenic or paleo diets. Similarly the quality of carbohydrate intake really needs to be addressed, for example someone who’s diet contained 60% low-GI carbohydrates, from a variety of sources would almost certainly fare better than someone eating an equivalent percentage of high-GI carbs, like pancakes and white bread. The outputs of this study have also perhaps been over-interpreted in some parts, possibly due to the authors statement of:“Our findings do not support the current recommendation to limit total fat intake to less than 30% of energy and saturated fat intake to less than 10% of energy. Individuals with high carbohydrate intake might benefit from a reduction in carbohydrate intake and increase in the consumption of fats.”Indeed later in the same article the authors are a bit more mellow with their message stating:
“Our findings indicate that limiting total fat consumption is unlikely to improve health in populations, and a total fat intake of about 35% of energy with concomitant lowering of carbohydrate intake might lower risk of total mortality.”Which actually fits within existing general health guidelines (albeit at the upper end), and does not point towards a very high fat intake. So how does the carb story fit in with the previous paper?