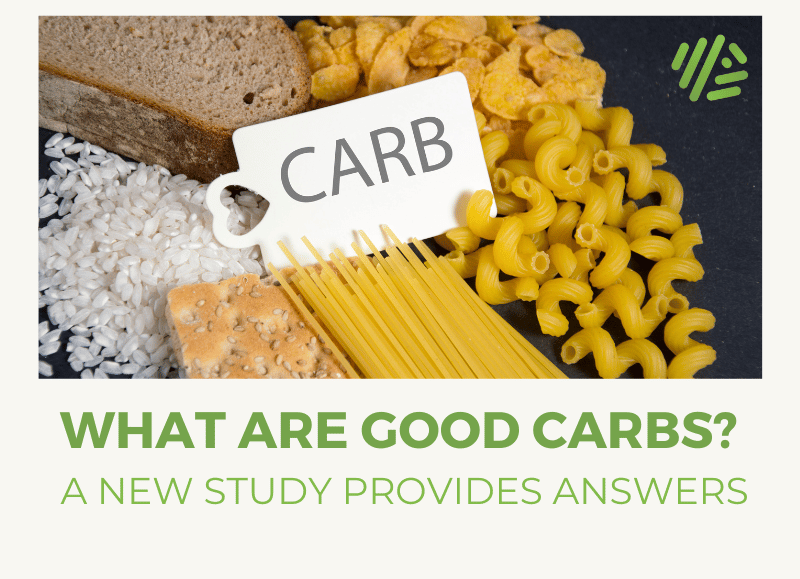
What are Good Carbs? A New Study Provides Answers
Article at a Glance
- Fiber is a great way to measure your carb quality.
- A new 2019 study in the Journal Lancet looked at fiber intake and mortality rates from a number of diseases.
- Based on the study findings, which show a reduced risk for a number of illnesses when consuming a diet higher in fiber, getting 25 grams plus a day of fiber would seem to be a best practice.
- A good carb is a high fiber carb that you can easily digest.
- However, the study authors did not evaluate total carbohydrate intake, just dietary fiber. As such, it would seem that those on a lower carbohydrate diet could add in good carbs that are high in fiber, but lower in carbohydrates, such as broccoli and leafy greens, and stay on the right track.
- Our overall winner for the best source of dietary carbohydrate is the sweet potato, or yam. High in fiber, relatively low glycemic load and packed with antioxidants like beta carotene.
Contents
Lancet study defines good carbs
The study: Carbohydrate quality and human health: a series of systematic reviews and meta-analyses Published in the peer reviewed Lancet journal in 2019, this large scale meta-analysis (meaning study authors broke down a bunch of studies to find trends) and systematic review attempts to describe how the source of dietary carbohydrate is key in maintaining health. This is occurring in an environment where more and more studies are recognizing that unrefined high-fiber carbohydrates, like yams and potatoes, are much more desirable than rapidly absorbed, often highly refined equivalents, such as bread and processed cereals.Study details
- Data from 185 prospective studies and 58 clinical trials was included in the analysis.
- Clinical trials had to last at least 4 weeks and compare low/high intakes of various quality carbohydrates.
- Studies looking at individuals with pre-existing conditions were excluded so the population included men, women and children without acute or chronic disease. They could however have prediabetes, mild to moderate high cholesterol, mild to moderate hypertension, or metabolic syndrome.
- Studies were required to measure markers of carbohydrate quality such as dietary fiber, dietary glycaemic index or glycaemic load, and whole grain intake.
- Outcomes were all-cause mortality, coronary heart disease mortality, and stroke mortality; and incidence of coronary heart disease, stroke, type 2 diabetes, and colorectal cancer.
The results – what are good carbs?
The results are summarized nicely by four graphs, which split measures into:- Total fiber consumed (in g/day),
- Whole grain intake (g/day)
- And glycemic index or how fast a carbohydrate spikes blood sugar (GI units per day)
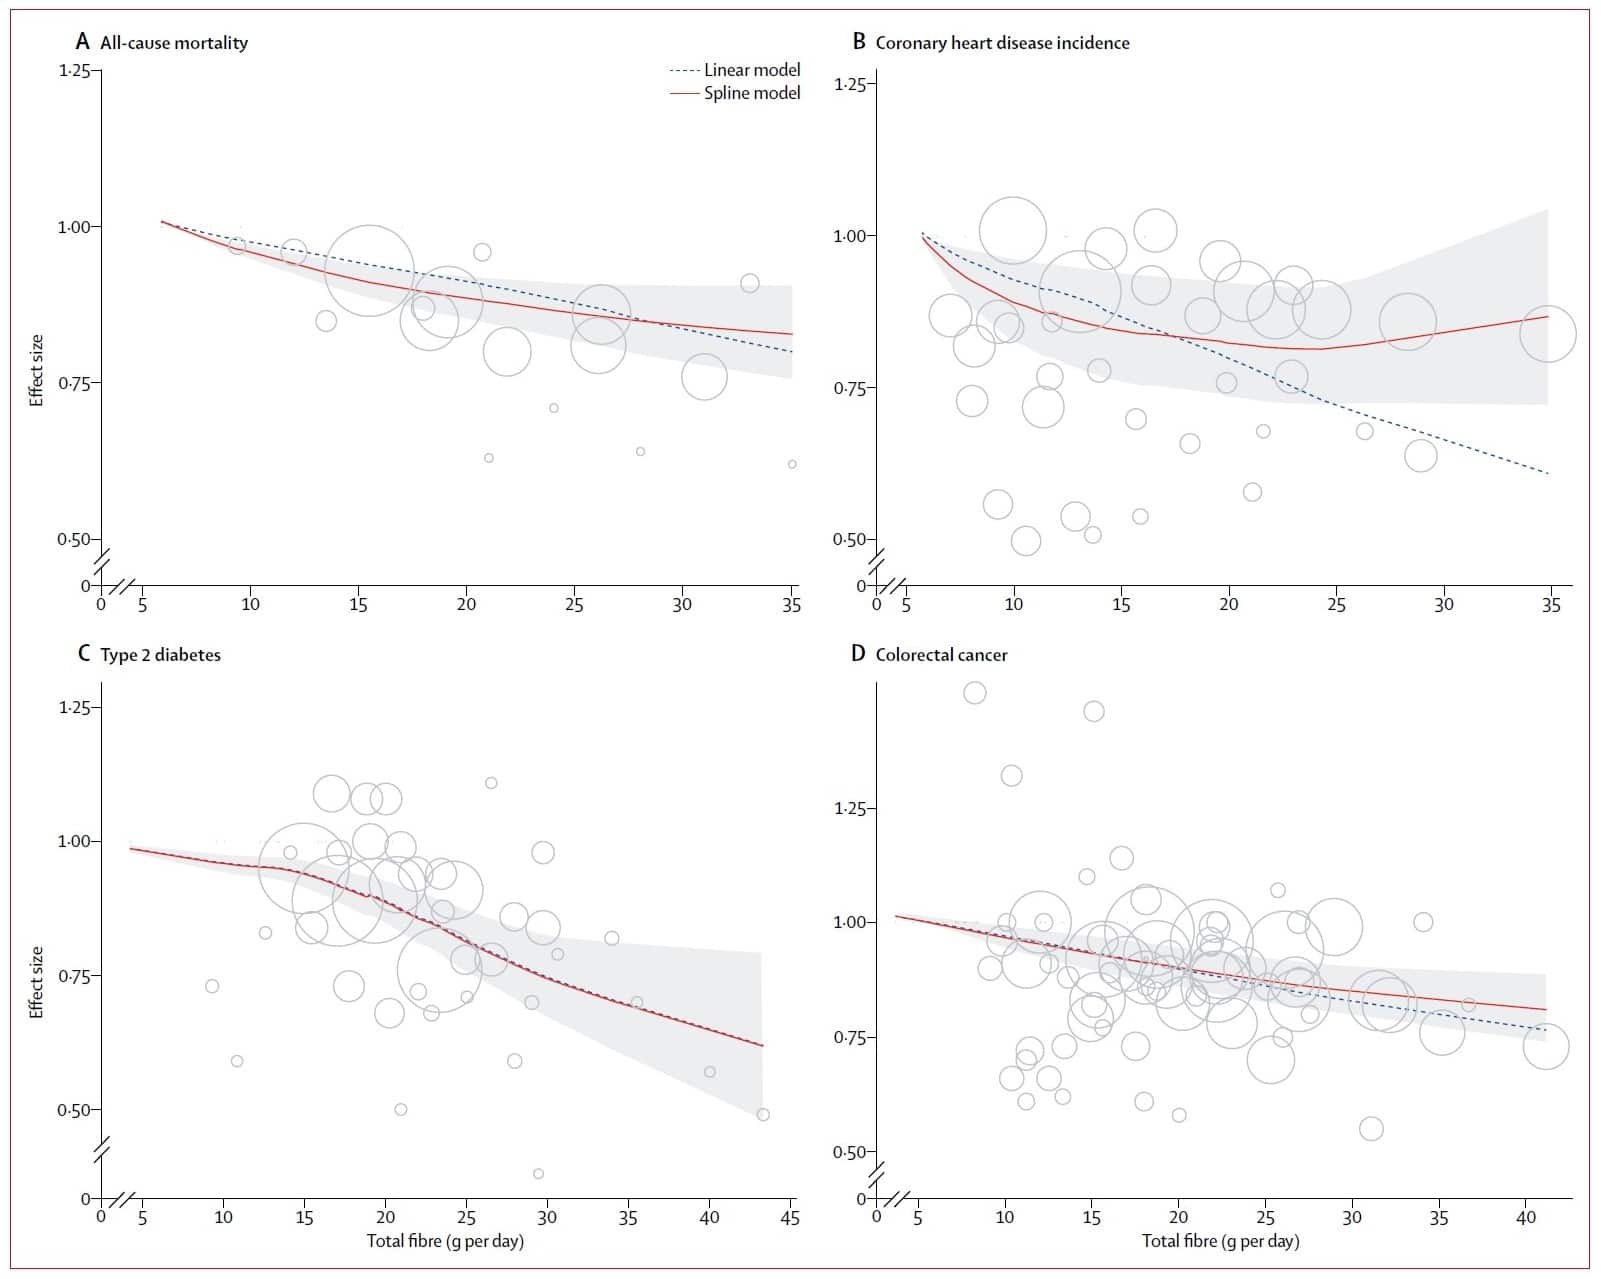
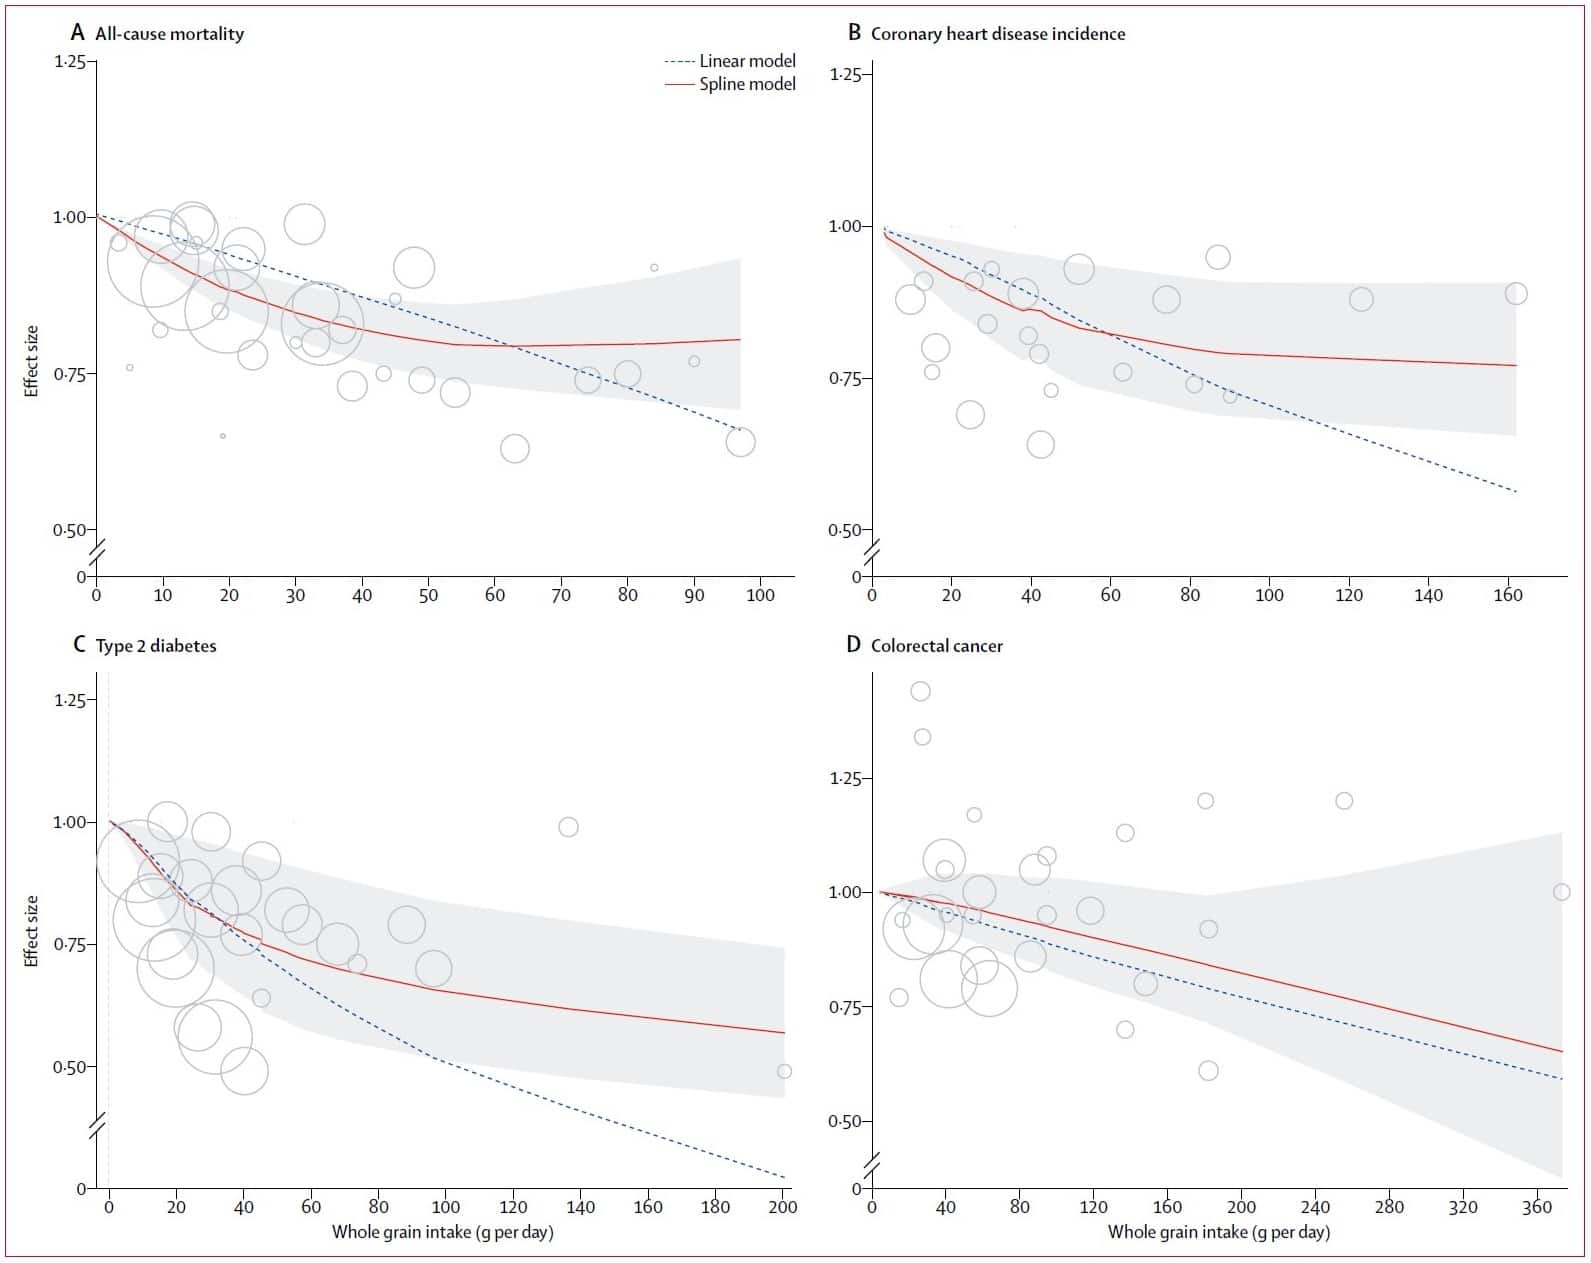
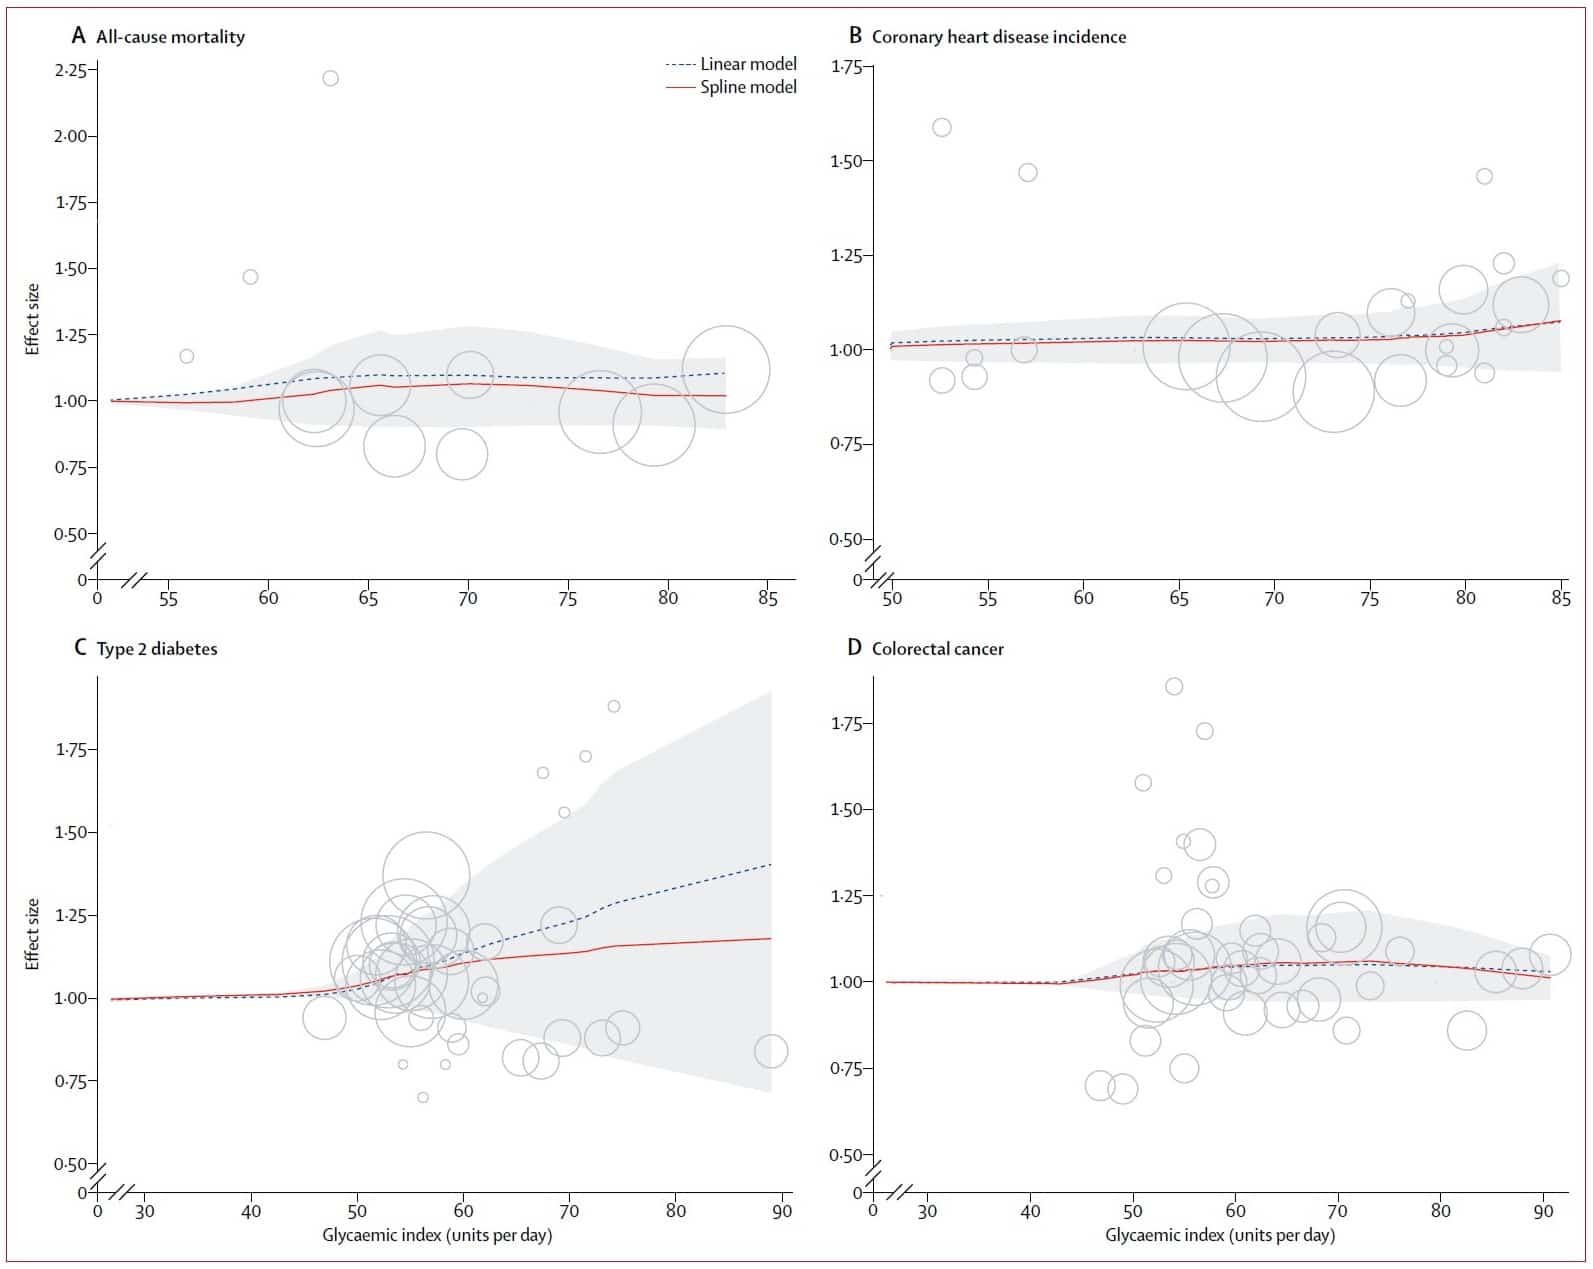
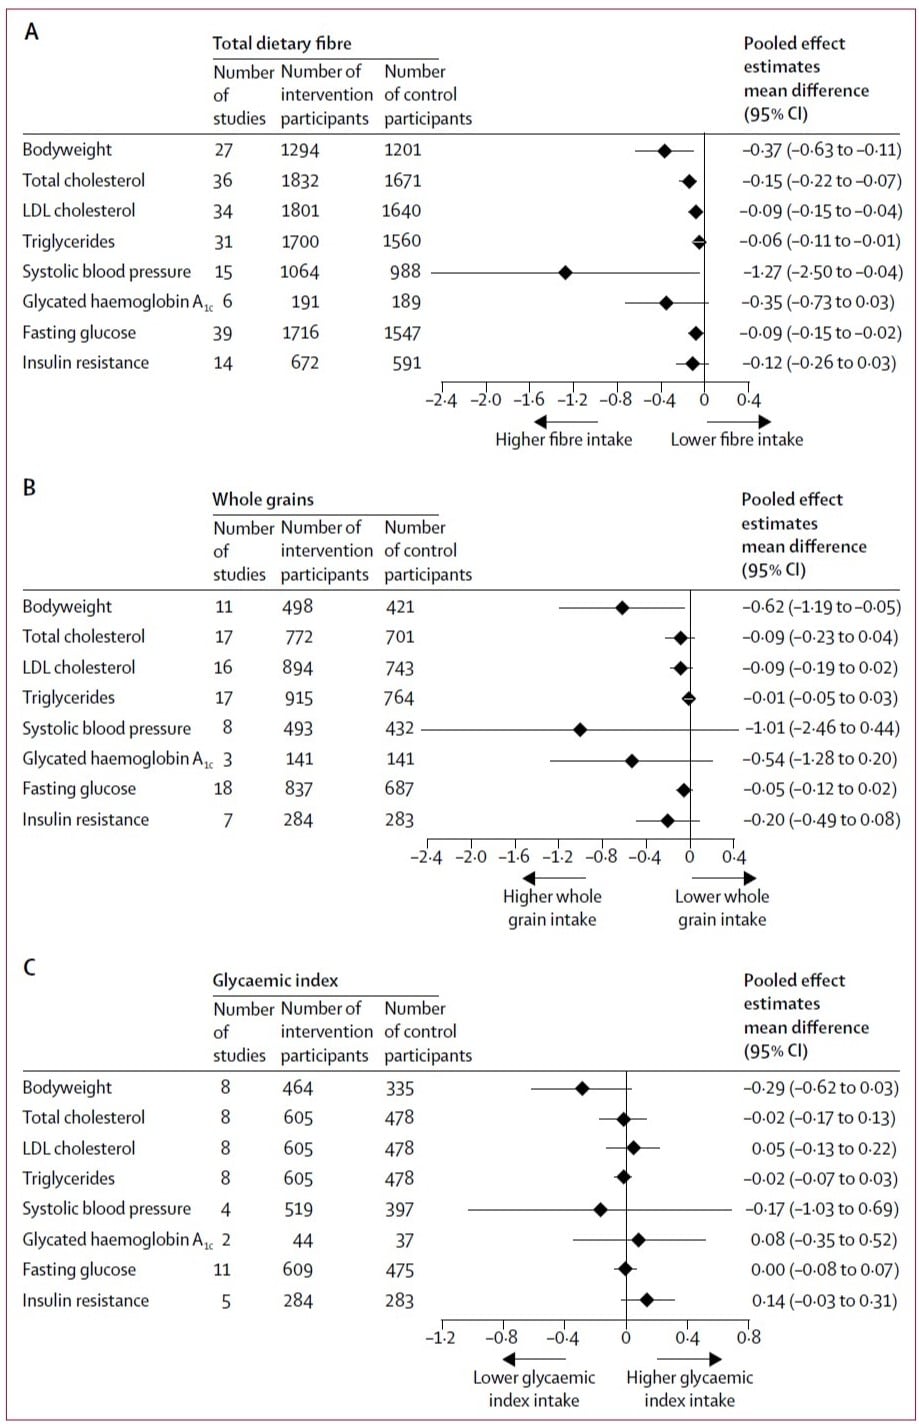
To take some quotes from the authors: “These findings, together with the comparisons of clinical outcomes among individuals with different intakes of dietary fiber, suggest that individual adult intakes of total dietary fiber should be no less than 25–29 g per day with additional benefits likely to accrue with higher intakes.” “The similar protective effects of higher intakes of whole grain foods and of dietary fiber suggest that the beneficial effects of whole grains could be because of their high dietary fiber content.” “Until evidence is available, it seems appropriate that dietary advice should emphasize the benefits of naturally occurring dietary fiber in whole grains, vegetables, and fruits that have been minimally processed.”
Criticisms?
Total carbohydrate intake
The authors of the study did not incorporate total carbohydrate intake as a measurement in their study, which would have helped address some of the issues relating to specific diet types. For example, does it matter whether the fiber intake is achieved by eating a small total number of carbohydrates, which are all fiber-rich, or is it acceptable to eat a larger amount of carbohydrates, some of which may be fiber-poor, as long as the fiber threshold is reached? Other studies would suggest that a range of overall intakes are acceptable (R), but further breakdown would have proved very insightful.Non-grain sources of carbohydrate
Many other fruits and vegetables are also rich in fiber, and may contain other nutrients that provide additional benefits. Other studies have shown a similar benefit to increasing fruit and vegetable intake (R), however the contribution of fiber to this effect remains unknown. It is likely that fiber source is not key, and so a mixed fiber intake will prove most beneficial.Self-reporting bias
Not a criticism of this study as such, but rather the wider field of dietary research. The lack of easily measurable biomarkers means that assessing carbohydrate intake relies on self-reported intake, which is prone to error and misreporting. By incorporating clinical trials into their study the authors address this somewhat, but the lack of strong effect in metabolic markers may be driven by this effect.Our thoughts
After parsing the study, an important question is how do these intakes relate to the average diet, and to those following particular dietary styles? Well, in European populations it is thought that the average intake of fiber per day is around 20g, with an average of about 15g in the U.S. (R). Looking at those levels on the first graph you can see that they are having a beneficial effect compared to very low fiber intakes, but they could easily be improved. There are no real figures out there for those following paleo or ketogenic diets, but for those following a paleo diet there should be no issue incorporating fiber from non-grain based sources. Ketogenic diets may be more troublesome, with the generally very low carbohydrate intake limiting the potential intake of fiber, so this should be considered when undertaking this diet type. Vegans and vegetarians are obviously at the lowest risk here as a plant-rich diet should be rich in fiber by default (R). Data for wholegrain intake is more difficult to find, but this study from the UK in 2015 suggests that the typical adult will have an intake of around 20g/day (R), and that this is actually declining as well. Again vegans and vegetarians will likely do well here due to a typically high grain intake (R). Figures from ketogenic and paleo diets are again difficult to find, but we can presume a low intake for both. However it is likely that wholegrain intake is actually just a proxy for fiber intake, and it is the beneficial effect to fiber rather than wholegrain that we’re seeing here, and this is something the authors themselves discuss.The best carbs
Based on the data in this study, the best carbs are those that are fiber rich and that you can digest effectively. The last thing to do is start eating foods that are hard on your stomach because a blog told you to do so. Having said that, if you can incorporate some of these foods, while avoiding sources of carbohydrate that have very little in the way of fiber, like white bread, processed cereals and the like, all the better. Note, we also believe the source of carb should be tailored to the individual’s ability to deal with spikes in blood sugar, which is something we emphasize in our custom nutrition plan diet types.- Yams and sweet potatoes (our overall winner)
- Potatoes
- Oats
- Beans
- Broccoli
- Carrots
- Avocado
- Apples
- Cauliflower
- Quinoa
- Brown rice
- Leafy greens
- Strawberries
- Natto